The issue with task groups or how I discovered a solved problem
This post is not my usual format but there is a moral at the end, so hang around if you have a little time to waste.
The setup
I’m working on a longer blog post about the process of optimizing some concurrency Swift code. At a point I used John Sundell’s CollectionConcurrencyKit to compare the performance of different approaches.
After I had my numbers, I peaked into his code to double check what exactly am I measuring. The code concurrently runs a task for each element in a sequence so I expected to find a task group but instead the implementation is simply:
|
|
I asked him why did he use a bunch of loose tasks and he said he did it to easily preserve the order of elements in the result. (Which definitely makes sense to me given the task at hand in his library.)
Note: Would it not be very handy if
TaskGroup.addTaskreturned the task instead of void? In such case you’d be able to either process task results in order by walking the tasks or as they get completed by iterating the group.
So, next I rearranged his code to use a TaskGroup and, just in case, measured the performance again.
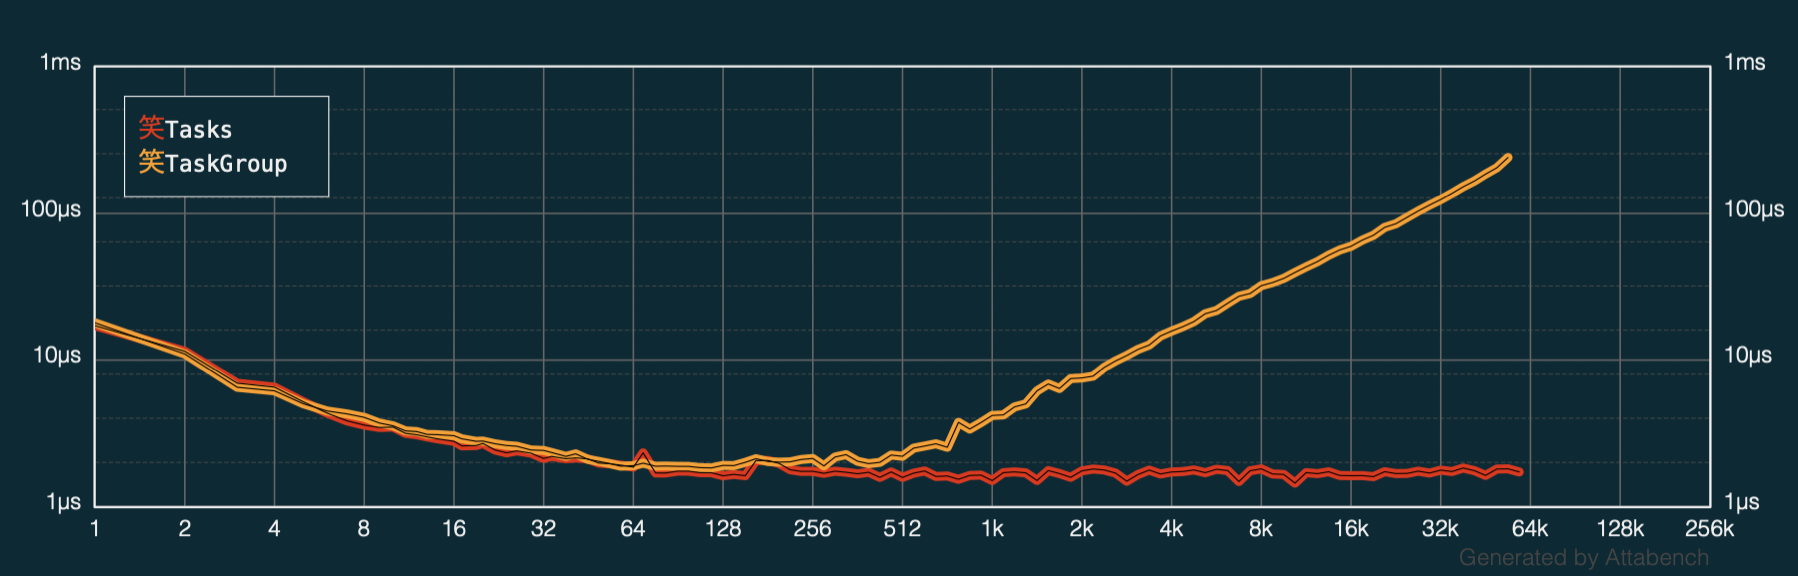
To my surprise, the results weren’t even similar — the TaskGroup code was about three times slower than the loose Task variant…
I went few times back and forth to remove code cruft and optimize as much as I can but the task group code was still much, much slower.
In fact, I used Attabench and plotted the performance of the same amount of tasks as a loose bunch and in a group (higher is slower):
After I ruled any problems with my bespoke, artisinal code I remembered Károly’s pre-Apple talk about Optimizing Collections and how at a given size the under-the-hood algorithm will change and performance will too.
Note: Watch that talk — it’s a complete cs class in 20 minutes and Károly is great at presenting the results.
So my best guess was that to keep track of the group hierarchy, tasks are stored in some data structure, probably a tree, that borks the performance of adding/removing a node at a certain size.
A solution
At this point I was already getting anxious because I have a perfect record of unanswered radars and that seemed like an issue that needed to actually be reported and fixed.
Luckily, I thought I’d first check in with some other people if they see the same issue and this is how I got directed to this PR: 5.6: Fix SR-15785 by adding a cached reference to … — it spoke about my exact problem and even mentioned accessing the last node in a linked list as the root cause!
Looking at the changes it seems that this comment and code below it made it into the 5.5 release:
// We need to traverse the siblings to find the last one and add the child
// there.
// FIXME: just set prepend to the current head, no need to traverse.
Well, good news everyone! The fix is already merged to swift/main and the 5.6 merge is pending at the moment.
So I took my test app that was supposed to go into radar and compared the results. The app runs loose tasks and groups of various sizes and measures how much time they spend on average per completed task.
Release Swift 5.5 results:
swift build -c release && ./.build/release/TaskGroupTestApp

 Group: Size 64, Rep 99/100
Task: 0.0025s x task, Group: 0.0024s x task
-----------------------------------------------
 Group: Size 2048, Rep 99/100
Task: 0.0022s x task, Group: 0.0026s x task
-----------------------------------------------
 Group: Size 17000, Rep 99/100
Task: 0.0030s x task, Group: 0.0077s x task
You see that the 17K task group runs more than 100% slower than the loose tasks and performance only gets worse when increasing the group size onwards.
Running the same code with swift/main and 5.7-dev:
swift-dev build -c release &&
DYLD_LIBRARY_PATH=/Library/Developer/Toolchains/swift-latest.xctoolchain/usr/lib/swift/macosx/ \
./.build/release/TaskGroupTestApp

 Group: Size 64, Rep 99/100
Task: 0.0024s x task, Group: 0.0024s x task
-----------------------------------------------
 Group: Size 2048, Rep 99/100
Task: 0.0023s x task, Group: 0.0025s x task
-----------------------------------------------
 Group: Size 17000, Rep 99/100
Task: 0.0028s x task, Group: 0.0032s x task
Awesome! There is still a slight decrease in performance but it looks like a reasonable cost to pay for the group hierarchy, en-mass cancellation, and so forth. Props to David Smith for the fix!
Moral of the story
As promised … there is a moral in this story, even a few. Let’s see:
- When it comes to performance, don’t trust anyone and measure everything. I would’ve expected a note in the
TaskGroupdocs for such a big performance issue but alas. - The tooling is getting better. But especially with big changes like the new concurent model it happens iteratively over time.
- Community is important — within few hours of posting on slack I got reaffirmation of the problem, discussed it, and ultimately got the PR link and tested with the fixed compiler build.
I think this is a good story after all… and I think it makes a good prelude to my next post where I show optimizing some concurrent code. Till then!
Where to go from here?
If you’d like to support me, get my book on Swift Concurrency:
Interested in discussing the new async/await Swift syntax and concurrency? Hit me up on twitter at https://twitter.com/icanzilb.