Introducing timeui
A little while ago I coded a minimal profiling tool for the macOS command line and called it timeui. Last week I pushed the source code online in the hope other people would like it and use it (and eventually contribute some code too).
In this post I’ll introduce you quickly to timeui and what it can currently do for you.
What is timeui?
timeui is a command line tool that profiles an app you provide it and shows duration, apple’s universal logging intervals, CPU usage and memory footprint:
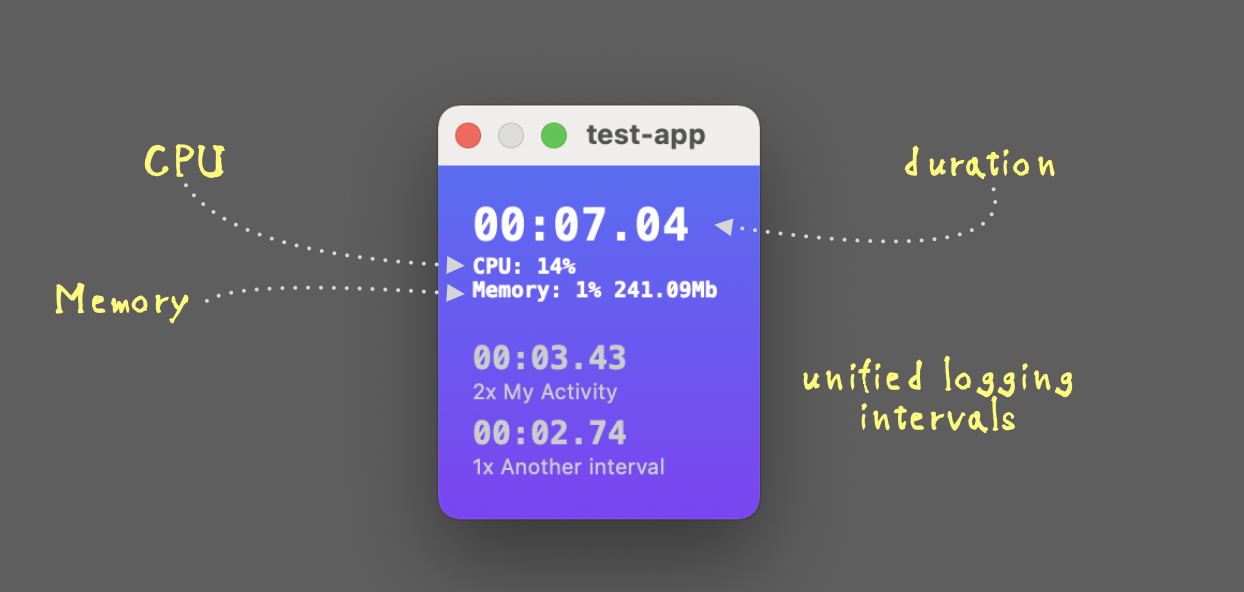
Note: You get CPU and memory footprint only running as a root user, e.g. when using
sudoto start timeui.
Note: The name is a play on the
timecommand — it’s like time, but with UI.
Usage
Let’s use timeui on a super simple shell script that looks like this:
|
|
Yes, the app you’re targeting doesn’t need to be Swift — timeui will work with any executable.
Let’s run timeui:
|
|
This opens timeui’s window and starts simple.sh:

Once the target app completes, timeui prints the duration to the output and waits for you to close its window.
Get more out of timeui
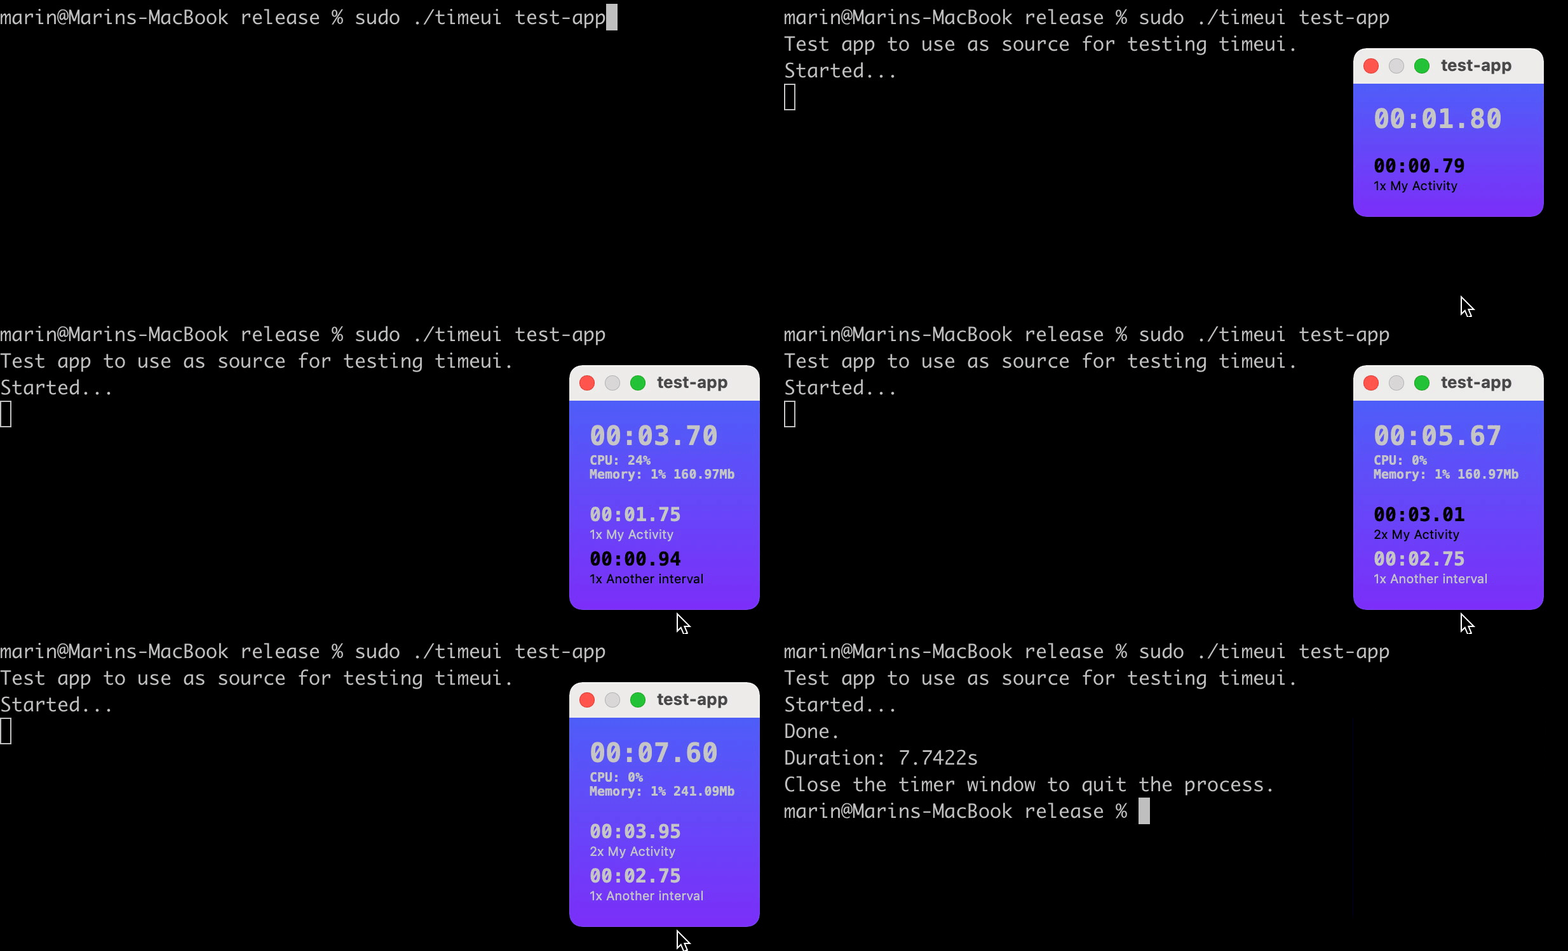
Beyond being a simple stopwatch timeui would also measure the duration of your signpost intervals and system usage.
The repo includes a demo app. You build the package targets and run from the build directory this:
|
|
test-app starts few signpost intervals and creates few arrays in memory which you can observe well from the command line:
Where to go from here?
The timeui repo is https://github.com/icanzilb/timeui — clone the package and run install.sh to build the app and copy the product to /usr/local/bin so you can use it from anywhere.
I’ve only put a few hours in this tool but I can think of a bunch of nice, minimal features that would make it a really great one. I’ll be happy if others would contribute too: https://github.com/icanzilb/timeui/issues.
Thanks for reading! If you’d like to support me, get my book on Swift Concurrency:
In case you want to talk more, hit me up on twitter at https://twitter.com/icanzilb.

